ACE Framework Theory
Causal inference at Pearl's second rung. Pearl's causal hierarchy [2] distinguishes three levels of reasoning: observation (Rung 1, “what is”), intervention (Rung 2, “what if I act”), and counterfactual (Rung 3, “what if it had been otherwise”). AI-assisted Modeling, Simulation, and Analysis (MS&A), mission planning, and battle management live squarely at Rung 2: the planner must answer “what happens to mission success if the force commits platform i to waypoint v or releases weapon w at time t,” not merely “how did that maneuver correlate with success in historical engagements.” This distinction is foundational. Observational data alone cannot identify the mechanism of a control parameter beyond a Markov equivalence class of plausible structures [3, 4]: a correlation between a maneuver X and mission outcome Y is equally consistent with X driving Y, with Y driving X, or or with a third factor Z, such as an adversary's posture, driving both. This common-cause ambiguity cannot be resolved by any amount of passive observation. Only by actively intervening on X (executing the maneuver in a representative battlespace and observing the response of Y) can its causal effect be separated from confounding [3]. The ACE Framework operates exclusively in this interventional regime, which is precisely why it can certify that a learned battle-management behavior is causally responsible for mission success rather than an artifact of correlated training conditions.
The active experimentation problem. Given a Structural Causality Graph (SCG) supplied by domain experts, the governing question is which interventions to run. The combinatorial space is often intractable: in a recent analysis of how a complex hybrid space communications architecture supported naval operations, we had to optimize 7 parameters with 10 settings each, full-grid enumeration is 10^7 simulations. Classical theory bounds the number of interventions sufficient to identify causal relations among N variables [8] and establishes that adaptive designs require strictly fewer interventions than non-adaptive ones [9], but offers little guidance on the sequential choice of which parameter to intervene on and at what value. Traditional methods are sharply limited. Random sampling and full Design-of-Experiments grids treat interventions as static schedules and cannot adapt to what has been learned. Greedy information-maximization strategies, including the Bayesian Optimal Experimental Design (OED) methods that represent current published state of the art [6, 7], choose each intervention by maximizing expected information gain under the current posterior; these are principled but myopic, evaluating each step in isolation and unable to learn a multi-step strategy from experience. Worse, the Bayesian-OED family must maintain a posterior over graph structures, which is NP-hard and combinatorial in the parameter count [14], capping published demonstrations near twenty variables [7]. ACE sidesteps posterior maintenance entirely: it treats experimental design as a sequential decision problem and learns the policy from the campaign itself, which is what lets it operate in the thirty-parameter regime where the prior art does not scale [1].
The policy as a pretrained forward model. Choosing a pretrained transformer as the experimental policy is a deliberate theoretical commitment, not an engineering convenience [1]. Rung-2 design requires a forward model: the policy must anticipate “what will happen if I intervene on parameter X with value v,” and the quality of any policy is bounded above by the quality of its forward-model prior. An MLP trained from scratch begins with a uniform prior and must construct the entire forward model from experience; a one-step Bayesian acquisition function carries a correct but shallow prior; a human battle manager brings deep prior knowledge of how tactical parameters propagate. A language model pretrained on scientific and technical text is the closest computational analogue of that human prior: its weights encode a soft distribution over how variables in real systems relate causally, and published benchmarks confirm this prior is genuinely informative for causal-direction and mechanism queries [11]. Because in-context conditioning behaves as implicit Bayesian inference under that prior, prompting the policy with the SCG, the per-parameter losses, and the recent intervention history yields an approximate posterior-predictive distribution over sensible next interventions, which Direct Preference Optimization then specializes to the system at hand. Two structural properties make this practical for battle management: the action space (parameter, value) is emitted natively as text, so larger missions simply produce longer prompts without any change to the network; and the policy is model-scale-agnostic, demonstrated here at the 1.5B-parameter Qwen2.5 scale [13] and trivially upgradable to 70B-class production models.
ACE architecture (Figure 1). At each step ACE assembles a context describing the current state of the campaign: the structural causal graph, the current per-parameter mechanism-estimation losses, and a summary of recent intervention history. It renders this context as a structured prompt to the transformer policy, which generates K=4 candidate interventions in textual form (e.g., “do(waypoint_2_lat = 34.7)” or “do(weapon_aimpoint = ...)”). Each candidate is evaluated via lookahead: a cloned copy of the MLP student learner receives the data that executing the candidate would produce against the environment, and the resulting per-parameter loss reduction estimates the candidate's information value. The highest-scoring candidate is executed against the mission environment (the StarCraft II battlespace of SOW Task 4); the MLP student is updated with the new evidence; and the highest- and lowest-scoring candidates form a preference pair used to fine-tune the transformer policy via Direct Preference Optimization [5]. The composite reward that ranks candidates combines three components: information gain (the loss reduction from lookahead), node importance (parameters whose current mechanism estimates are poor receive higher weight), and a diversity term (under-sampled parameters and intervention values receive higher weight). The published component ablation establishes that the diversity term is non-optional: removing it causes the policy to collapse onto a single parameter and degrade below static baselines [1].
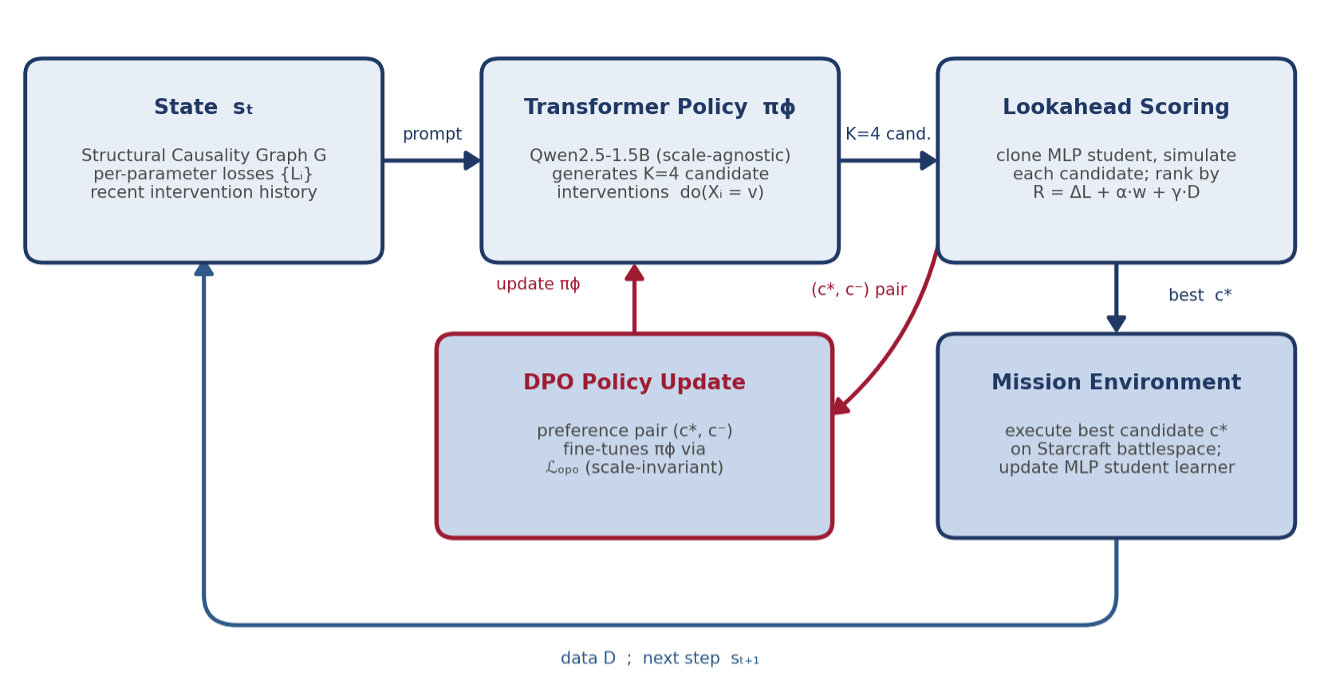
Figure 1
The transformer policy proposes K=4 candidate interventions from the current campaign state; lookahead scores each on a cloned student learner; the best candidate is executed on the mission environment and the (best, worst) pair updates the policy by scale-invariant DPO. Lookahead is a training-time signal only and is not used at deployment.
Lookahead as expected-information-gain estimation. The lookahead loss reduction is not an ad-hoc heuristic but a Monte-Carlo estimate of the mutual information between the mechanism parameters and the data a candidate intervention would generate; the node-importance term acts as a non-uniform prior that upweights poorly-understood mechanisms. ACE therefore pursues the same expected-information-gain objective as the Bayesian-OED methods [6, 7], but it does so through learned, multi-step policy optimization rather than explicit one-step posterior computation, which is precisely why it surpasses the OED baseline at matched intervention budgets. Critically for the proposed effort, this lookahead is a training-time signal only: once the policy is trained, intervention selection is a single transformer forward pass with no cloning or simulation, so the train-once-versus-inference-only economics quantified in SOW Task 5.3 follow directly from the architecture [1].
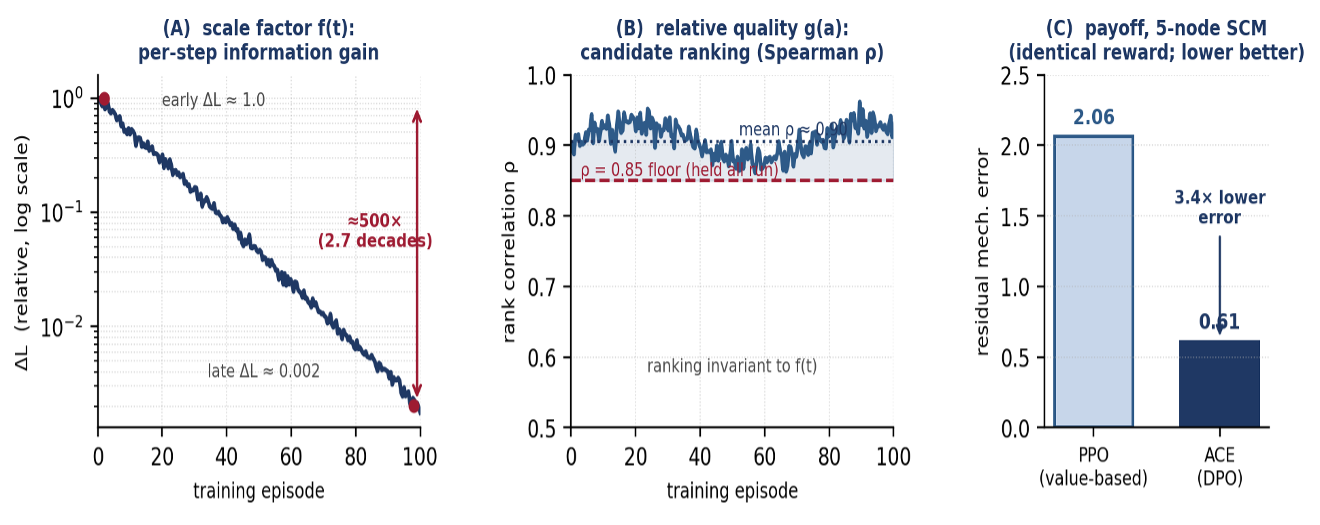
Why preference learning rather than value-based reinforcement learning (Figure 2) for Mission Planning. Active experimentation has a structural property that breaks standard value-based RL formulations: information gain is inherently non-stationary. Early interventions on an uninformed model produce large loss reductions; late interventions on a near-converged model produce negligible ones. The published ACE work measures roughly a 500x decay in expected information gain over a single training run [1]. Formally, the per-step reward decomposes as r_t(a) = f(t) g(a), where f(t) is a monotonically diminishing scale factor (the vanishing information gain) and g(a) is the approximately stationary relative quality of action a. A value-based RL critic [12] is therefore asked to predict a target whose magnitude shifts by orders of magnitude across the run, producing chronic value-prediction error and policy plateau (the published PPO baseline, given ACE's identical reward signal, stalls at 2.06 versus ACE's 0.61). Direct Preference Optimization [5] resolves this by consuming the candidate ranking rather than the candidate values: under the decomposition above, the ordering of any two candidates depends only on g(a) and is provably invariant to f(t), so the preference pairs fed to DPO remain well-defined throughout training even as absolute reward magnitudes collapse. Empirically the ranking is stable (Spearman correlation greater than 0.85) across the full training arc even when expected information gain drops two orders of magnitude (Figure 4) [1].
Emergent strategy as evidence of mechanism understanding. The clearest demonstration that ACE learns a principled strategy rather than memorizing surface heuristics is its emergent behavior on collider configurations. In a structural causal graph, a collider is a parameter with two or more direct causes; causal theory says that identifying the mechanism of a collider requires interventions on its parent parameters, not on the collider itself. Without being told this rule, the trained ACE policy autonomously concentrates 99.8 percent of its interventions on the parents of collider nodes (versus 40 percent under uniform sampling), and the collider mechanism-estimation error reduces by a factor of 60 [1]. The same logic transfers directly to collaborative battle management: when a mission outcome such as successful penetration of a defended target is jointly driven by the routing and weapon-release timing of several mutually-supporting platforms, ACE will autonomously concentrate its experimental budget on those upstream drivers rather than squander interventions on the coupled downstream response. This is precisely the reasoning a seasoned air battle manager applies when coordinating mutual support; ACE recovers it from experience alone.
ACE Framework Benchmarks
ACE has been validated against five baseline methods on three computational domains representative of high-dimension causal optimization problems. On a 5-node synthetic Structural Causal Model containing mixed mechanism types (linear, trigonometric, and quadratic) and a collider configuration, ACE achieves a median total mechanism estimation loss of 0.61 at convergence (mean 0.92 ± 0.73 across 5 seeds), versus 1.99 median (mean 2.04 ± 0.12 across 3 seeds) for the Bayesian Optimal Experimental Design baseline that represents current published state of the art. This is a 69 percent reduction in residual mechanism error at matched intervention budgets and is statistically significant at p < 0.001. The traditional baselines (Random sampling, Round-Robin coverage, and Maximum-Variance acquisition) plateau between 2.09 and 2.21, confirming that strategic adaptation rather than additional data drives the improvement. A Proximal Policy Optimization (PPO) value-based reinforcement learning baseline given the identical reward signal plateaus at 2.06, demonstrating the practical impact of the preference-learning argument outlined in the Theory subsection.
On a 30-node hierarchical Structural Causal Model representative of multi-layer engineering systems (root parameters, intermediate couplings, collider nodes, and leaf observables), ACE achieves a best total mechanism loss of 1.95 ± 0.77, versus 5.80 ± 0.05 for Random, 5.79 ± 0.06 for Round-Robin, and 5.80 ± 0.04 for Maximum-Variance baselines, all of which converge to a common plateau with seed-level standard deviation below 0.08. This is a 3.0x improvement over the strongest static baseline and demonstrates that ACE scales to system sizes representative of the multi-platform mission planning optimization problems addressed in this effort without architectural modification. Phase I will extend this scaling envelope toward the 48-parameter regime of the six-ship AI MP & BM mission, where weapon-engagement-zone geometry, weaponeering assignments, and mutual-support couplings define a comparably structured causal system.
On a chain of three coupled Duffing oscillators, a canonical nonlinear physics benchmark with synchronization-induced spurious correlations between non-adjacent elements, ACE achieves coupling-parameter estimation error of 0.042 ± 0.036 versus 0.245 ± 0.121 for Random sampling and 0.238 ± 0.076 for Round-Robin (5 seeds, 100 episodes), a 5.8x improvement. The learned policy autonomously concentrates 62 percent of interventions on the intermediate oscillator whose clamping breaks the spurious correlation, again recovering the theoretically optimal experimental strategy from experience alone. Aggregate improvements across the three published benchmark domains range from 3.0x to 5.8x against the strongest comparable baselines, supporting the proposed Phase I claim that ACE renders contemporary optimization approaches obsolete for the high-dimension mission optimization problems the USAF faces.
Figure 2
The per-step reward decomposes as r(a) = f(t) g(a). (A) The scale factor f(t), the per-step information gain, decays about 500x over training (from a relative 1.0 to about 0.002), a moving target that a value-based critic must continually re-regress. (B) The relative quality g(a) keeps the candidate ranking stable: Spearman ρ holds above the 0.85 floor for the entire run, averaging about 0.90. (C) The consequence on the 5-node SCM at an identical reward signal is that the value-based PPO baseline stalls at 2.06 residual mechanism error while DPO-trained ACE reaches 0.61, a 3.4x reduction, because DPO consumes only the stable ranking and is invariant to f(t).
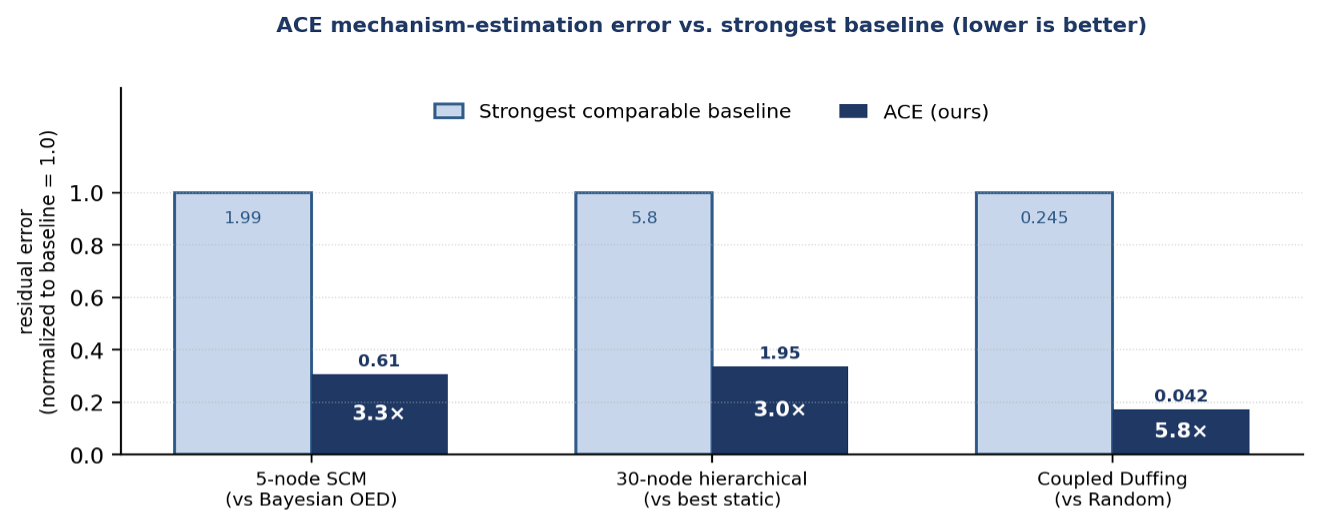
Figure 3
ACE versus the strongest comparable baseline on three published benchmark domains (residual mechanism-estimation error, normalized to baseline = 1.0; lower is better). Improvement factors range from 3.0x to 5.8x.
Land Attack Cruise Missile Mission w/ Space Communications Use Case
Decisive AI has applied the ACE Framework to a representative land-attack cruise missile operation in which a Blue destroyer launches TLAMs against two Red targets under satellite-enabled communications constraints. The scenario captures a broad capability space and traces the causal pathway between force-design variables and operational success. LEO/MEO satellite architecture, antenna power, orbital altitude, and jamming conditions determine in-flight target update availability for each TLAM. Update availability then determines missile terminal uncertainty, and terminal uncertainty determines whether enough missiles achieve the required engagement threshold per mission. Each mission consists of 30 TLAMs assigned to a Red target, with operational success requiring both target-level missions to achieve at least 70 percent successful missile engagement.
Figure 4 (left) shows a mock analysis authoring employing Decisive’s Mission Engineering ontology. Every entity (or group of entities, e.g. a satellite constellation) is allocated to a specific layer of the ontology: Campaign, Operations, Missions, Capabilities, Platforms, and Systems. Each layer is specifically defined with types of entities, entity definition parameters, and measures/metrics. Currently the entities are defined in a source data JSON with a custom User Interface (UI) for source data editing, but longer term we will implement the Ansys System Application Modeler (SAM) as part of the infrastructure to provide us a highly scalable Model Based Systems Engineering (MBSE) data curation capability. SAM has visual, relational views which make entity organization, definition, and maintenance easy. SAM also employs the SysML v2 language spec with 100% conformance and has an open spec API to JSON.
This mock analysis authoring diagram is an excellent example of a Structural Causal Model (SCM). In such SCMs, expert analyst experience is used to assert what could be causally important for the entities furthest to the right. In this case, we are assessing causal importance of various capabilities, platforms, and systems to the success of two missions. The lines connecting the missions to entities to their left asserts that the entities could be causally important to mission success—causally important, not simply correlated with mission success. The bubbles filled in grey are the parameters (and associated entities) that are under evaluation. A low and high value are defined for each. All other parameters are “clamped”—the are defined by the source data JSON nominals and are not varied or evaluated.
This is a complex analysis with 7 parameters under evaluation and 564,480 discrete options, but it takes an experienced analyst roughly 5 minutes to create the SCM and not much more than that to assess. This is how simple and effective Decisive AI’s infrastructure is for authoring and performing analyses which would have been impossible (not informative enough, takes too much time, costs too much) with previous Design of Experiment (DOE) or full-grid SaaS infrastructures. Our team has built and used both of these in the past and they served as our muse to develop the world’s highest performance Causal inference capability and make it available for you to use.
Figure 4 (right) shows Decisive’s analysis authoring UI. Available entities from the source data JSON are shown in the upper left and analysts can create the SCM (lower left) by either dragging and dropping entities from the upper left or right-clicking in the SCM and creating/linking entities. Defining analysis parameters and metrics are also performed by right-clicking the entities. As the SCM is created, the analysis definition JSON grows in the upper right. If the analyst selects a node then the node details are displayed in the middle right window. Fast effective authoring.
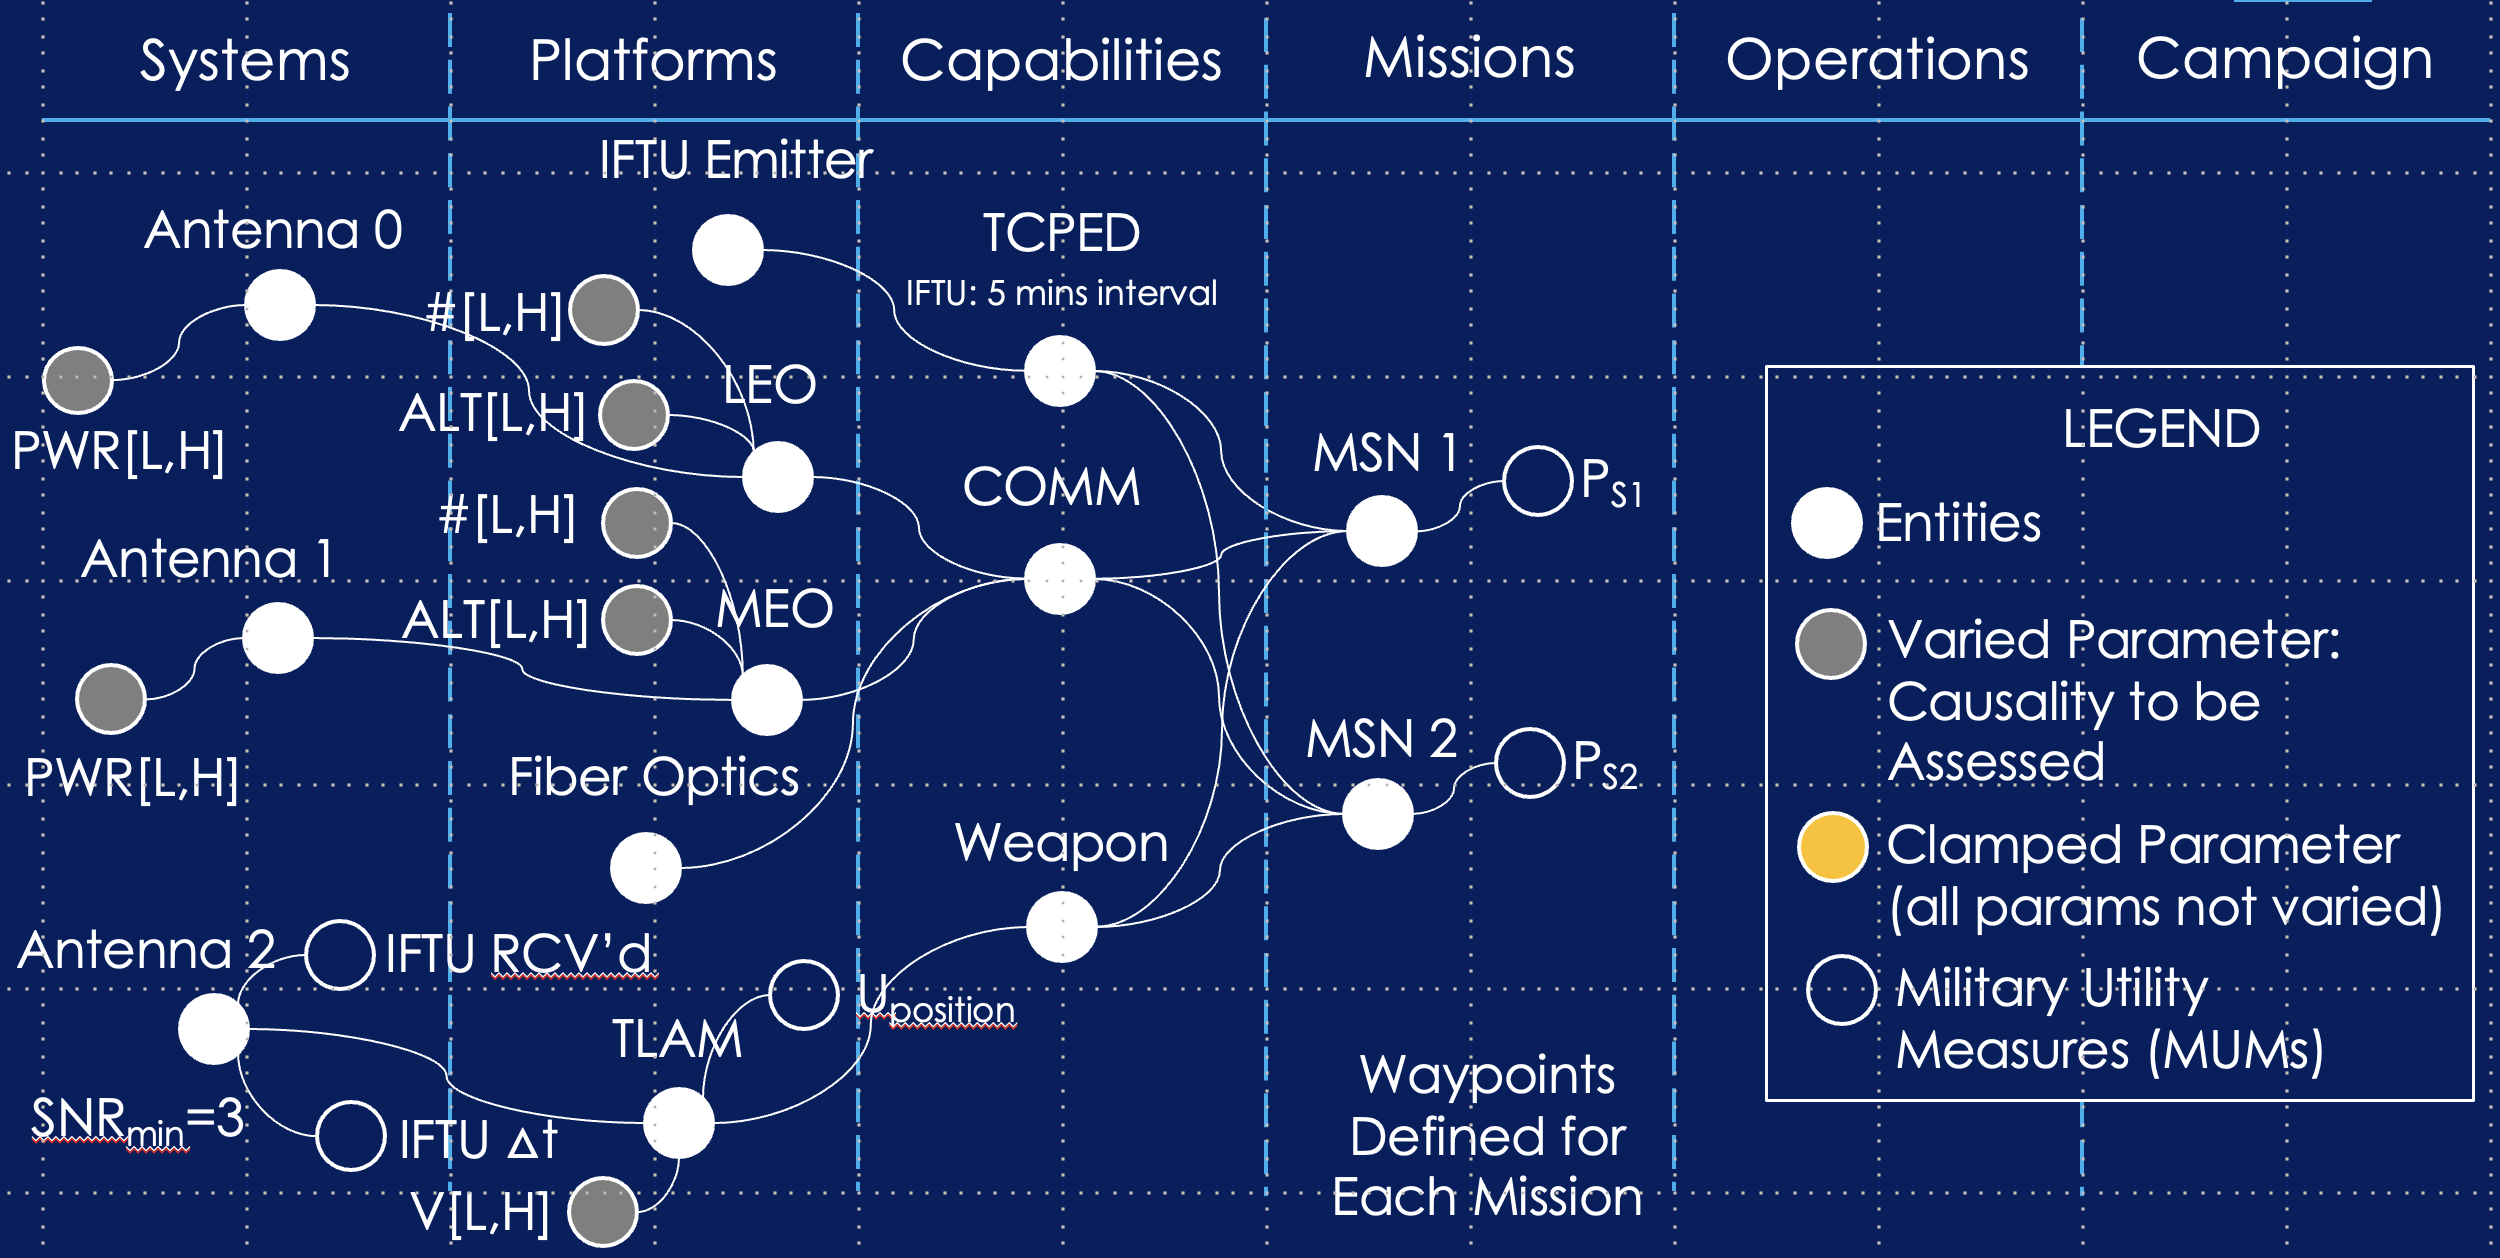
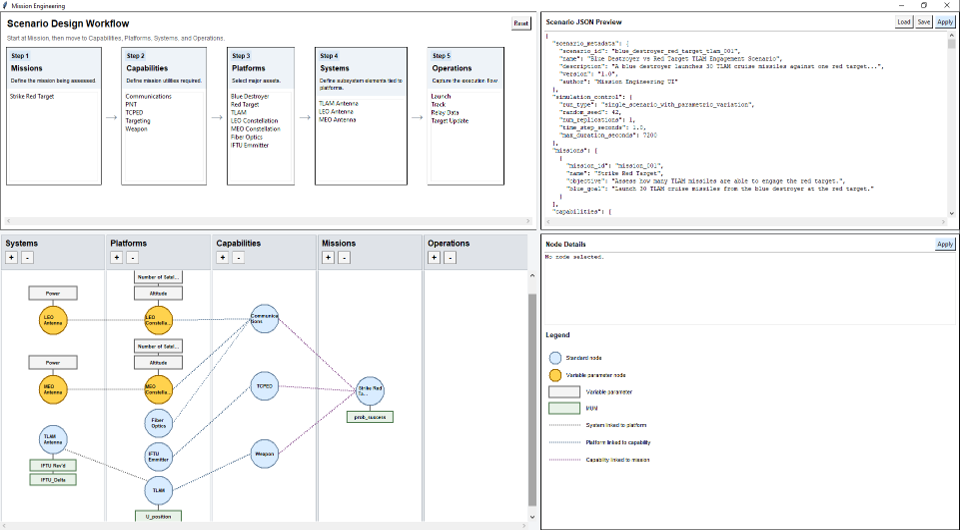
Figure 4
Mock space communications use case authoring (left) and Authoring User Interface (right)
The use case demonstrates ACE’s tangible advantage for high-dimensional mission planning. The principal independent variables include Blue LEO antenna power, LEO altitude, LEO satellite count, MEO antenna power, MEO altitude, MEO satellite count, cruise missile velocity, and Red mission/target-specific jamming. These variables interact nonlinearly and produce thresholded outcomes: small architecture changes may have little operational effect when the system is far below the communications-support threshold, large effect near the mission-performance “elbow,” and diminishing returns after adequate link margin and coverage are achieved. The trade space assessed in this example consists of 564,480 discrete possibilities for unique variable combinations, which is demonstrable of a trade space where grid search, random sampling, and traditional Design of Experiments may substantially over-budget on uninformative regions.
ACE avoids this inefficiency by algorithmically selecting interventions that are expected to most densely inform mission-specific mechanisms. At each step, the ACE policy proposes candidate interventions, evaluates their expected information value, executes the most informative intervention, and updates the student mechanism learner with the resulting evidence. The highest- and lowest-value candidates are converted into preference pairs that update the LLM policy through Direct Preference Optimization, improving subsequent intervention selection so later experiments are increasingly aligned with the causal structure of the mission. ACE therefore does not merely sample the trade space; it learns how to experiment on the trade space.
In the satellite communications SCM evaluation, ACE evaluated the mission mechanism and converged on causal relationships using only 15 total interventions (Figure 5). In fact, after just two ACE interventions approximately 80 percent of the eventual MSE reduction had been achieved, showing that ACE rapidly identified the dominant causal levers rather than requiring broad enumeration. ACE reduced predictive mechanism error to a converged MSE of 0.0381, while Random Sampling and Grid Search remained materially higher over the same intervention budget. The result demonstrates that ACE’s advantage is not simply more sampling; it is better experimental selection. ACE spends each run on high-information regions of the trade space, while static sampling methods continue allocating runs to low-sensitivity or already-understood regions. This result is operationally significant because mission planning does not require every possible design point to be simulated; it requires rapid identification of which parameters matter, where they matter, and which combinations move the mission from failure to success. In practice this is what we often rely on mission commanders for, but ACE can yield superior insights in novel or time-constrained situations.
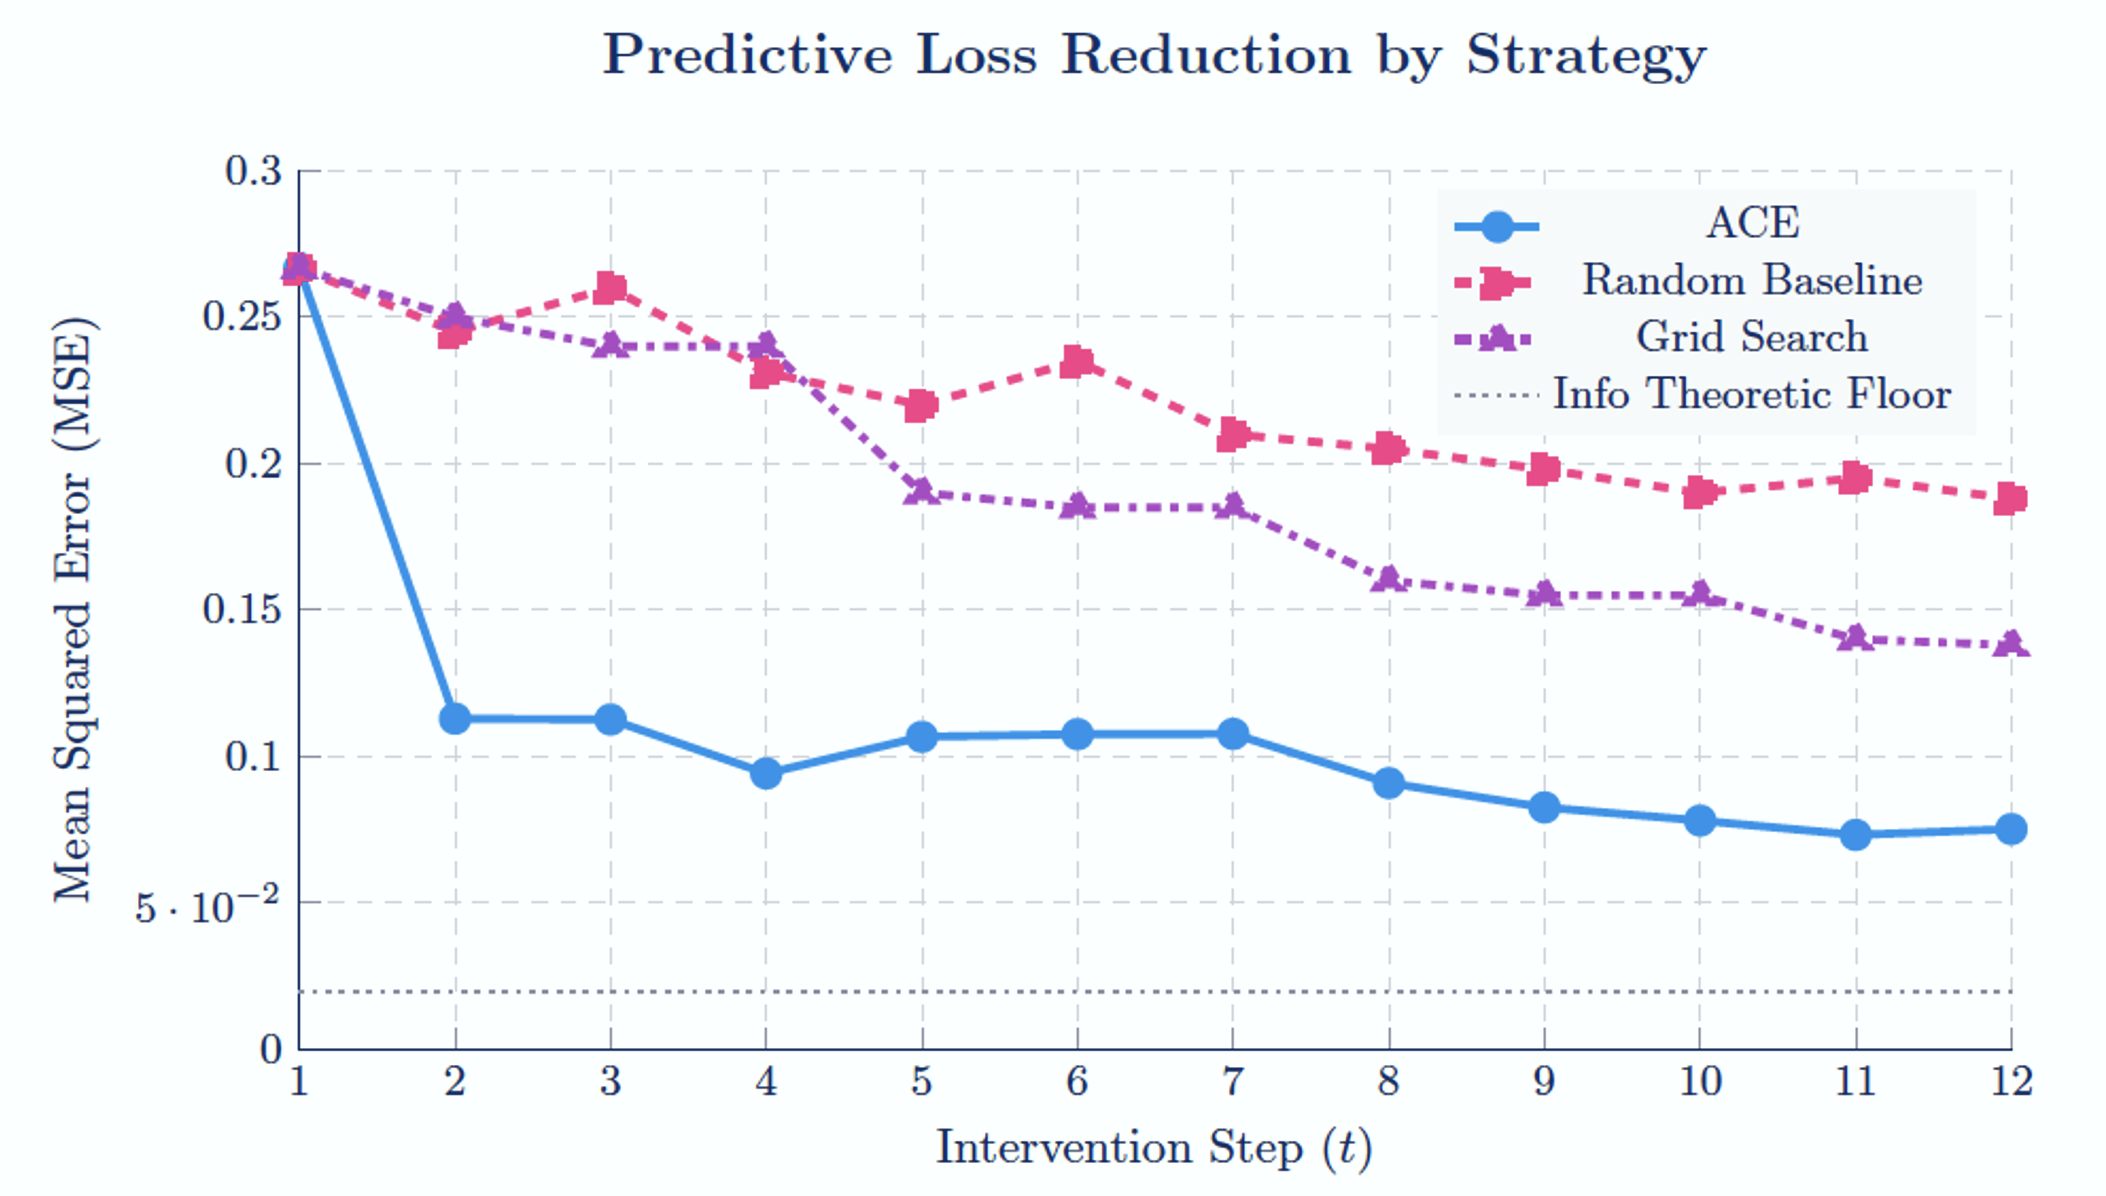
Figure 5
ACE Predictive Loss Reduction Compared to Random Sampling and Grid Search. ACE rapidly reduces mechanism prediction error by concentrating interventions on the most informative regions of the satellite communications trade space, demonstrating substantially greater sample efficiency than static or random exploration strategies.
This showcased capability directly supports the proposed Phase I AI Mission Planner and Battle Manager effort. ACE will be used to optimize increasingly complex mission planning settings maps and battle-management parameter spaces by learning which variables are causally significant, which are negligible, where nonlinear thresholds lie, and how coupled variables jointly determine mission success. The cruise missile satellite-communications use case demonstrates that ACE can discover variable importance, effect direction, interaction terms, saturation behavior, and success thresholds without brute-force enumeration. As the number of coupled mission parameters grows from 8 to 16 to 24 and toward the 48-parameter six-ship regime, the advantage of active causal experimentation compounds. ACE turns each simulation run into an information-maximizing experiment, providing the analytical speed, causal traceability, and parameter efficiency required to make high-dimensional AI mission planning feasible within Phase I timelines and transitionable to Phase II operational-scale mission design.
The resulting analytics (Figure 6) provide a deeper mission-engineering product than a scalar recommendation. SHAP functional graphs showed that Blue antenna power is a dominant positive driver of engagement rate, but that its value is conditioned by jammer EIRP and orbital geometry. As expected, it returned that the cruise missile flight velocity had no impact on the mission outcomes. CINDy symbolic recovery extracted an approximate engagement-rate equation containing both main effects and nonlinear interaction terms, including Blue antenna power, LEO altitude, MEO satellite count, Blue power squared, MEO count squared, Blue power–LEO altitude interaction, Blue power–MEO count interaction, and Blue power–jammer interaction.
These recovered terms expose several actionable insights: antenna power and constellation density improve mission performance but exhibit diminishing returns; higher LEO altitude degrades mission utility; and the operational value of Blue communications capability changes under adversarial jamming. ACE therefore identifies not only which variables are important, but also where additional investment stops paying off and which threat conditions alter the preferred design.
The recovered CINDy equation provides quantitative mechanism evidence. Overall Engagement rate was estimated as a function of positive main effects from Blue Antenna Power (+0.4855) and MEO Satellite Count (+0.1788), a negative main effect from LEO Altitude (-0.0923), and nonlinear saturation terms for Blue Power² (-0.1859) and MEO Count² (-0.1260). ACE also recovered coupled interaction terms, including Blue Power × LEO Altitude (-0.0905) and Blue Power × MEO Count (+0.1635), showing that mission performance depends on combinations of architecture variables rather than isolated one-factor effects.
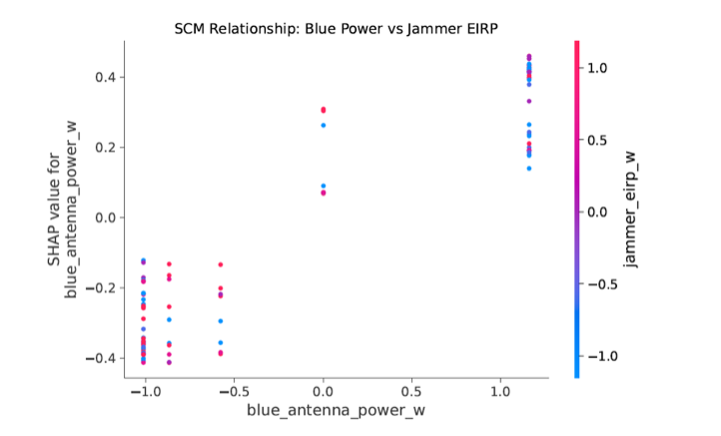
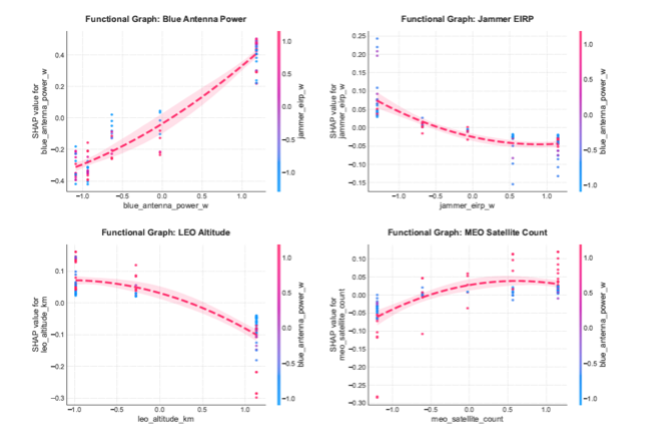
Figure 6
(Left) SHAP Interaction Between Blue Antenna Power and Jammer EIRP. The ACE-selected intervention data supports surrogate-based interpretation of nonlinear interaction effects, showing that the operational value of Blue communications capability changes under adversarial jamming conditions. (Right) Individual Functional Graphs (SHAP Dependence Plots) showcasing the marginal non-linear effect of the four primary SCM nodes on the Engagement Rate, colored by their strongest interacting feature. The red dashed lines represent a quadratic polynomial trend fit, surrounded by a 95% confidence interval zone to approximate the underlying functional form.
ACE Bibliography
[1] Cooper, P. and Velasquez, A. (2026). Active Causal Experimentalist (ACE): Learning Intervention Strategies via Direct Preference Optimization. Submitted to NeurIPS 2026.
[2] Pearl, J. (2009). Causality: Models, Reasoning, and Inference, 2nd ed. Cambridge University Press.
[3] Peters, J., Janzing, D., and Schölkopf, B. (2017). Elements of Causal Inference: Foundations and Learning Algorithms. MIT Press.
[4] Spirtes, P., Glymour, C., and Scheines, R. (2000). Causation, Prediction, and Search, 2nd ed. MIT Press.
[5] Rafailov, R., Sharma, A., Mitchell, E., et al. (2023). Direct Preference Optimization: Your Language Model is Secretly a Reward Model. NeurIPS 2023.
[6] Tóth, C., Lorch, L., et al. (2022). Active Bayesian Causal Inference. NeurIPS 2022.
[7] Tigas, P., Annadani, Y., Jesson, A., et al. (2022). Interventions, Where and How? Experimental Design for Causal Models at Scale. NeurIPS 2022.
[8] Eberhardt, F., Glymour, C., and Scheines, R. (2005). On the number of experiments sufficient and in the worst case necessary to identify all causal relations among N variables. UAI 2005.
[9] Hauser, A. and Bühlmann, P. (2012). Characterization and greedy learning of interventional Markov equivalence classes of directed acyclic graphs. JMLR 13.
[10] Shanmugam, K., Kocaoglu, M., Dimakis, A.G., and Vishwanath, S. (2015). Learning Causal Graphs with Small Interventions. NeurIPS 2015.
[11] Kıcıman, E., Ness, R., Sharma, A., and Tan, C. (2023). Causal Reasoning and Large Language Models: Opening a New Frontier for Causality. arXiv:2305.00050.
[12] Schulman, J., Wolski, F., Dhariwal, P., Radford, A., and Klimov, O. (2017). Proximal Policy Optimization Algorithms. arXiv:1707.06347.
[13] Qwen Team (2024). Qwen2.5 Technical Report. arXiv:2412.15115.
[14] Chickering, D.M. (1996). Learning Bayesian Networks is NP-Complete. Learning from Data: Artificial Intelligence and Statistics V.